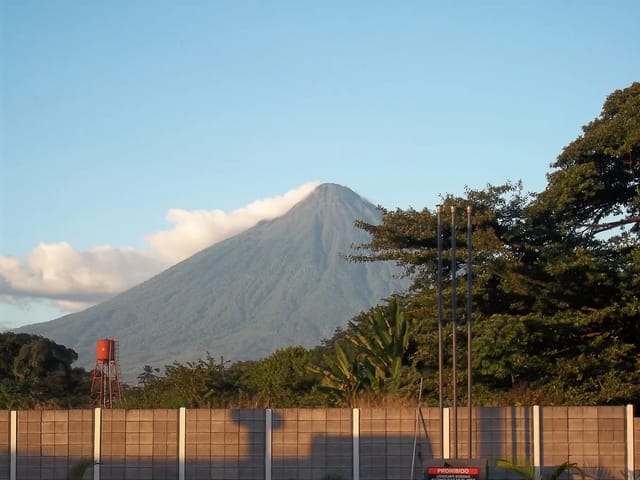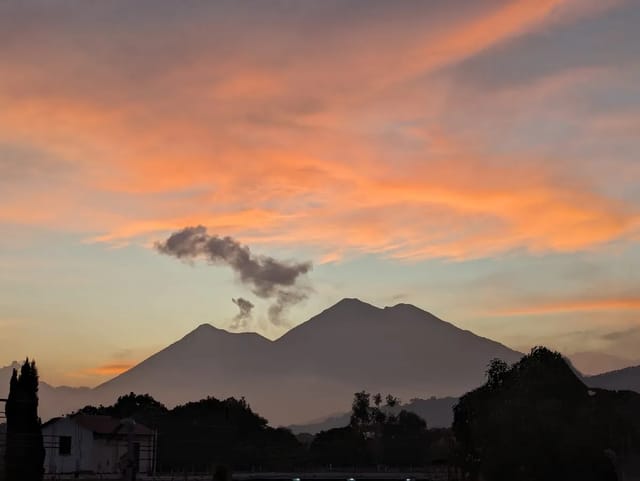
Guatemala’s Pacific coast is 250-odd kilometres of black sand with a serious shore break, a surf town that has grown fast at El Paredón, a turtle hatchery at Monterrico, and a working port at Champerico. The forecast that covers all of it is published by INSIVUMEH’s Oceanografía section, in Spanish, as PNG charts — and one PDF that only exists on the days something is wrong.
This page reads both.
Today, at INSIVUMEH’s eight Pacific forecast points
| Forecast point | Departamento | Wave height (m) | Period (s) | Swell (m) | Swell from | Wind (km/h) | Wind from | INSIVUMEH threshold |
|---|---|---|---|---|---|---|---|---|
| Las Lisas ⓘ | Santa Rosa | 1.16 | 17 | 0.72 | SW | 15.7 | S | none published |
| Monterrico | Santa Rosa | 1.04 | 14 | 0.66 | SSW | 9.7 | S | none published |
| Puerto San José | Escuintla | 1.12 | 17 | 0.68 | SSW | 11 | WSW | none published |
| Sipacate | Escuintla | 1.16 | 17 | 0.64 | SSW | 13.4 | WSW | none published |
| Tecojate | Escuintla | 1.16 | 17 | 0.64 | SSW | 13.2 | WSW | none published |
| Tahuexco | Suchitepéquez | 1.1 | 17 | 0.7 | SSW | 14.3 | WSW | none published |
| Champerico | Retalhuleu | 0.94 | 17 | 0.68 | SW | 13.5 | WSW | none published |
| Ocós stale ⓘ | San Marcos | 1.08 | 17 | 0.66 | SSW | 6.4 | NW | none published |
Wave and swell: ncep_gfswave025 (NOAA GFS-Wave, 0.25 deg) read at INSIVUMEH's own published forecast coordinates; wind: NOAA GFS. Both are model forecasts, not measurements. Significant wave height is a statistical average of the higher waves — individual sets run noticeably higher. Feed built 2026-09-20T16:58:45.065496Z.
The number is not the wave you will see
This is the single most misread figure on any surf forecast, and INSIVUMEH writes the correction into its own technical note:
Se reporta la altura significante de la ola que es una medida de la altura de la ola y corresponde muy de cerca a lo que un observador entrenado consideraría como la altura promedio de la ola. Se debe notar que la altura máxima de la ola en una ola individual será significativamente más alta.
And it repeats the warning in plainer terms further down the same page:
Si la altura significante está fuera de los valores típicos, se debe tomar precaución ya que las olas pueden alcanzar valores mucho más altos que el reportado en este pronóstico.
Decision rule: read the column as a comparison between days at the same beach, not as a measurement of the wave in front of you. A 1.2 m reading with a 17-second period is a very different ocean from a 1.2 m reading with an 11-second period — long-period energy arrives as fewer, heavier, better-organised sets, which is exactly what a surfer wants and exactly what makes a shore dump dangerous for a swimmer. The period column is on the table for that reason.
Why it matters at all is INSIVUMEH’s own framing:
La importancia del pronóstico del oleaje radica en las distintas actividades que pueden resultar afectadas por la altura del oleaje, poniendo en riesgo el desarrollo de las operaciones, y más importante, la vida de las personas.
The warning product: when a bulletin exists at all
There is no daily marine warning. INSIVUMEH issues a special bulletin only when a site is forecast to cross its own threshold:
Se genera un boletín especial cuando la altura de la ola supera los umbrales máximos establecidos para cada uno de los sitios de interés. En total, se realizan pronósticos para ocho (8) sitios en el Pacífico y tres (3) en el Atlántico. La información descrita en los boletines incluye el sitio de ocurrencia (lugar y departamentos), día, hora y la excedencia (cm).
Here is the most recent one this page could read:
BI-OCE-2026-226 · dated 2026-09-15
| Site | Departamento | Litoral | Threshold (m) | Day | Hours | Over by (cm) |
|---|---|---|---|---|---|---|
| Punta de Manabique | Izabal | Atlántico | 0.52 | Martes 15 | 00:00–03:00 | 1 |
| Punta de Manabique | Izabal | Atlántico | 0.52 | Martes 15 | 06:00–09:00 | 1 |
| El Quetzalito | Izabal | Atlántico | 0.75 | Martes 15 | 00:00–12:00 | 16 |
Source: INSIVUMEH, Boletín Informativo — Altura Significante de la Ola. A bulletin names only the sites that exceeded their own published threshold, and the exceedance is the height in centimetres above it.
Note what that means in practice. The bulletin doubles as the only published record of the thresholds — because it names a site only when that site crossed its own line. The two values on record from the bulletin captured on 20 September 2026 are both Atlantic: Punta de Manabique at 0.52 m and El Quetzalito at 0.75 m, in Izabal. No Pacific site has appeared in a bulletin we have read, so no Pacific threshold exists on this page and none has been invented. The threshold column fills itself in over time, bulletin by bulletin, and each value records which bulletin stated it.
That also tells you how site-specific these numbers are. A 0.52 m line on a sheltered Caribbean bay and an open Pacific beach break are not remotely the same sea.
Tides, and the Puerto Quetzal trap
INSIVUMEH publishes a four-day tide forecast for two Pacific points, built from real gauge records with the harmonic method:
Partiendo del método de armónicos y mediante la librería pytides de Python3 se generó el script que analiza los datos registrados por las estaciones mareográficas de Puerto Barrios , Champerico y Puerto San José , obteniendo así un pronóstico de 4 días partiendo del día de publicación de esta sección.
- Puerto San José — prsj.pdf. Gauge: Comando Naval del Pacífico CONAPAC.
- Champerico — prch.pdf. Gauge: Empresa Portuaria Nacional de Champerico – Guatemala.
The trap is the third item on that page. It is a long-range annual tide calendar for Puerto Quetzal, and INSIVUMEH’s own text disclaims it harder than any reader would:
Debido a que la serie temporal de Puerto Quetzal cuenta únicamente con tres años de datos discontinuos, con más de 20 años de antigüedad, la precisión de la amplitud de las mareas pronosticadas no puedo ser determinada y, por lo tanto, no se incluyó en este calendario, sin embargo, si se logró determinar una incertidumbre para los horarios de bajamar y pleamar.
Con base en este análisis, se obtuvo que la incertidumbre en los horarios de bajamar y pleamar para el pronóstico de Puerto Quetzal es de ±11min .
So: no tide heights at all, times good to about ±11 minutes — and the calendar published there when we read it on 20 September 2026 was the 2023 one. Use the Puerto San José file instead; it is four days ahead and built on a live gauge.
The season that changes this coast
Guatemala’s Pacific swell is not driven by its own weather. The winter pattern arrives from the north, and CONRED spells out the mechanism:
Un frente frío es una franja de inestabilidad que ocurre cuando una masa de aire frío choca con una masa de aire caliente. Esta interacción provoca un descenso en la temperatura, lo que se traduce en un clima más frío en las zonas afectadas. Durante estos fenómenos se pueden presentar fuertes vientos, lluvias, incremento del oleaje en las costas.
How many, and when — from CONRED’s season-opening bulletin of 1 November 2025:
se pronostica el ingreso de alrededor 16 frentes fríos entre los meses de octubre 2025 y marzo 2026, siendo los más intensos entre noviembre y febrero
Sixteen fronts in six months is roughly one every eleven days, concentrated in the four months a northern-hemisphere traveller is most likely to be here. Plan a coast trip in that window with a spare day, and check this page the morning you commit to it. The same cold air that lifts the swell is what puts the highlands under a frost watch — see frost alerts for the other end of the same weather.
Tropical systems are the other driver, and those have their own page: hurricane tracker.
What else INSIVUMEH publishes on this coast
Its Oceanografía section also runs forecasts of salinidad superficial del mar, temperatura superficial del mar and vientos superficiales, plus coastal water sampling — including monitoring for red tide off Escuintla. We make no claim about red-tide status, closures or dates; the monitoring line exists, and any actual status has to come from INSIVUMEH or MARN directly.
Per-site charts, if you want INSIVUMEH’s own graphic rather than our table, sit at
insivumeh.gob.gt/hidrologia/oce/oleaje/ — pac_mtr.png for Monterrico, pac_spc.png for
Sipacate, pac_psj.png for Puerto San José, and so on. They are rebuilt daily at 07:30.
Getting there, and what else to check
- El Paredón sits in the municipio of Sipacate, which is the forecast point on the table. Getting there: Antigua to El Paredón. What to do there: El Paredón surf.
- Monterrico: Antigua to Monterrico and the turtle release, which is a nesting-season activity and has nothing to do with the swell.
- The coast is split between two departments — Escuintla and Santa Rosa.
- Inland water is a different instrument entirely: river levels reads the 45 gauges INSIVUMEH publishes daily, and weather alerts explains who declares what.
How this page is built and when it updates
- Warnings: INSIVUMEH, Boletín Informativo — Altura Significante de la Ola, fetched each run from bi-oce-oleaje.pdf and parsed for the bulletin id, the sites, their thresholds and every exceedance row.
- Forecast: NOAA GFS-Wave at 0.25° via Open-Meteo, plus NOAA GFS for wind, queried at INSIVUMEH’s own published coordinates for each of its eight Pacific points. This is the same model INSIVUMEH names on its own page.
- No threshold is ever typed by hand. Each one is learned from a bulletin and stamped with the bulletin id that stated it; a site with no bulletin on record shows “none published”.
- A failed fetch never overwrites good data. An unreadable bulletin keeps the previous one with a visible stale badge — an unreadable warning source is never rendered as “no warning”.
- Two of INSIVUMEH’s points sit on a land-masked model cell (Las Lisas, Ocós) and return zeros. Zero is not a wave height, so those rows are read at the nearest wet cell 0.25° offshore and flagged.
- Cadence: INSIVUMEH rebuilds its wave charts daily at 07:30 local; we re-read the model and the bulletin on each daily data run.
- Sources and captures for every quotation on this page:
content/research/pacific-marine-forecast-2026-09-20.md.
Frequently Asked Questions
Does Guatemala publish a marine forecast?
Yes, and it is one of INSIVUMEH’s least-known products. Its Oceanografía section publishes wave-height charts for eleven coastal points — eight on the Pacific and three on the Atlantic — updated daily at 07:30 local time, alongside tide forecasts for Puerto San José and Champerico and forecasts of sea-surface temperature, surface salinity and surface winds. There is no ‘boletín marino’ at that name: the products are the pronóstico de oleaje and the pronósticos de marea.
What model is behind the numbers?
NOAA’s GFS-Wave. INSIVUMEH states it on its own forecast page: the data come from the NOAA numerical model GFS-Wave, and its special bulletins repeat it. This page reads the same model at 0.25-degree resolution, at INSIVUMEH’s own published coordinates for each site, so the two should broadly agree. It is a model forecast and not a buoy measurement — the only instruments INSIVUMEH names on this coast are the tide gauges at the Comando Naval del Pacífico in Puerto San José and at the port authority in Champerico.
Is a 1.2 metre wave height safe to swim in?
The number does not answer that, and INSIVUMEH says why. What is reported is significant wave height, which it describes as close to what a trained observer would call the average wave height, adding that the maximum height of an individual wave will be significantly higher. So the sets on a 1.2 m day run noticeably above 1.2 m. Guatemala’s Pacific beaches are steep, dark-sand beach breaks with a heavy shore dump and no lifeguard service we can source; treat the figure as a relative indicator across days, never as a permission slip.
When does INSIVUMEH issue a wave warning?
Only when a site is forecast to exceed its own established threshold. The special bulletin — Boletín Informativo, Altura Significante de la Ola — then names the site, its departamento, its litoral, the threshold in metres, and per site the day, the hour window and the exceedance in centimetres above the threshold. Because it names only the sites that crossed, the thresholds themselves are published piecemeal, one bulletin at a time.
What is the wave threshold for El Paredón or Monterrico?
No Pacific threshold appears in any bulletin we have read. The only two on record from the bulletin captured on 20 September 2026 are Atlantic: Punta de Manabique at 0.52 m and El Quetzalito at 0.75 m, both in Izabal. We will not invent a Pacific figure or reuse an Atlantic one, so the threshold column on this page says ’none published’ for all eight Pacific points until a bulletin names them. Thresholds are site-specific — a 0.52 m threshold on a sheltered Caribbean bay tells you nothing about an open Pacific beach break.
Where do I get tide times for the Guatemalan Pacific?
INSIVUMEH publishes four-day tide forecasts for Puerto San José and Champerico, generated with the harmonic method from the records of the tide gauges at the Comando Naval del Pacífico and the Empresa Portuaria Nacional de Champerico. One caution: the long-range calendar on the same page is for Puerto Quetzal, it is a 2023 calendar, it carries no amplitude at all, and INSIVUMEH itself puts the uncertainty on its high- and low-water times at plus or minus 11 minutes, because the underlying record is three discontinuous years ending in 2002.
Why does the swell get bigger in winter?
Cold fronts. CONRED’s own explainer lists what a frente frío brings and puts higher coastal waves in the list alongside strong winds and rain, and its season bulletin forecast around 16 cold fronts between October 2025 and March 2026, with the strongest between November and February. That is the window when a Guatemalan Pacific beach day is most likely to be called off by the sea rather than by the sky.
Are the coordinates on this page the beach itself?
No — they are INSIVUMEH’s own offshore forecast points, copied from its wave-forecast page. Monterrico’s point sits at 13.75°N, 90.50°O, Sipacate’s at 13.92°N, 91.15°O, and so on. Two of them, Las Lisas and Ocós, fall on a grid cell the wave model treats as land and return an all-zero row; rather than publish a zero, the collector steps the query 0.25 degrees offshore until the model answers and flags those rows. Everything else is read exactly where INSIVUMEH reads it.