Tracking window: 10 days since the previous capture; the new / price-cut badges refer to that span.
Asking prices, captured from the agencies' own public sites and from the portals they advertise on. Quetzal prices are converted to USD at the Banguat reference rate of Q7.6414/US$ dated 2026-10-15, and the card also shows the original quetzal amount. "% vs zone median" compares construction $/m² against that zone's median (zones with ≥5 priced listings). Every card links to the seller who published it.
When several sellers offer the same property, the card names each one with the price that seller asked on the capture date; a difference usually reflects a stale copy, furnishings or taxes included, not a negotiable spread.
Save this search: email alerts for new listings and price cuts are on the way
We re-capture every seller we track roughly every two weeks. Email alerts for this search are being built: set the filters above, leave your email, and you will be first in when they go live, with what changed in this search at every capture.
Your search:everything in Lake Atitlán
How this works
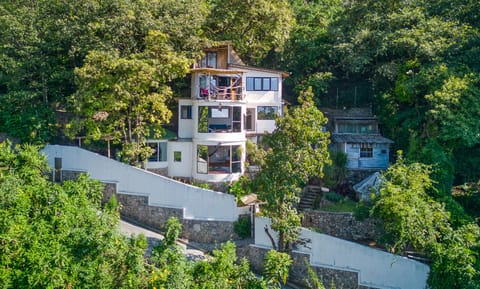
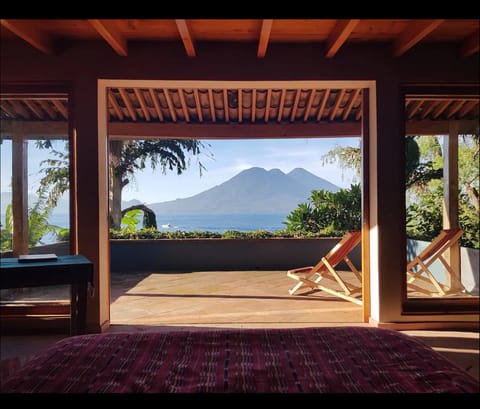
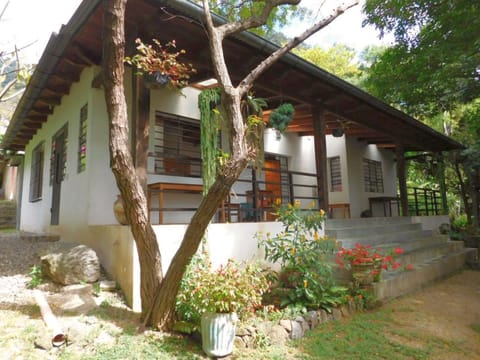
We capture the public sale inventories of agencies selling around Lake Atitlán directly from their own websites, add the listings that independent sellers publish on the portals, unify them (the same property advertised in two places is merged, and the card says where else it appears), and refresh every two weeks. Every seller in the corpus is named in the Agencies & sellers we track table above the grid, with its listing count and the date we last captured it — that table is built from the data, so no count typed on this page can contradict the grid. Attribution is the product: each card carries the name of the seller who published the property and links back to their own page for it. Each card carries one thumbnail loaded from the seller’s own site, a short excerpt and a link to the original advert; we do not copy galleries or full descriptions, and private sellers appear as “private seller” without names or phone numbers. A seller who wants a listing removed from this grid can write to stu@livinginguatemala.com and it comes down at the next deploy.
The badges come from comparing snapshots over time: price cut (the asking price dropped, with the old price struck through), new (appeared since the last snapshot) and a days-listed badge (present across the full tracking window). A source only earns badges once we have captured it twice, so a source added in the current cycle carries none until its second capture; the badges then appear on their own, without anything else on the page changing. When a listing disappears it becomes no longer listed: sales are inscribed at the property registry finca by finca, not in a list we can match these listings against, so we never call a property sold.
Which villages the grid covers
The village filter is generated from the listings, not from a list we typed, so it follows the corpus. At the 5 October 2026 capture it covered:
Panajachel
Santa Cruz La Laguna
Santa Catarina Palopó
Santiago Atitlán
San Lucas Tolimán
San Marcos La Laguna
San Antonio Palopó
San Pedro La Laguna
San Andrés Semetabaj
Santa Clara La Laguna
San Pablo La Laguna
Sololá
Listings we cannot place in a named village stay in the corpus under Other in the same filter. How many listings each village holds, and what they are asking, is the filter’s own answer — pick a village on the grid and the count moves with the data instead of with this paragraph.
What the numbers on the cards mean
The grid above holds 144 Lake Atitlán sale listings right now; that figure is rendered from the same file as the cards, so it cannot drift away from them. Houses, land, apartments and commercial property are all in the corpus — the type filter splits them — and every card is an asking price published by a named seller, never a sale price. How many listings each seller has, and the date we last captured them, is in the agency table above the grid. Some listings come from an agency’s own website and some are seen on a portal where an agency or an owner advertises; each card says which, and names the seller either way.
Currency. Sellers who advertise in US dollars are shown in dollars. Quetzal asking prices are converted at the Banguat reference rate printed under the grid — rate and date both come from the same data file as the listings — and those cards keep the original quetzal amount next to the converted figure.
$/m² and the village median. Where a listing publishes a construction area we compute its asking price per m². The “% vs zone median” comparison needs at least five priced listings with a known construction area in the same village, so it only appears where the data supports it; a village under that threshold shows the $/m² figure alone, and a listing with no published construction area shows neither.
What this viewer does not do
It does not rank the villages, quote a market average, or tell you what anything sold for. Everything here is a public asking price on a known date, from a named seller, with the arithmetic — price per m², village median, price change between snapshots — done in the open. It is the buyer’s-side view of an unusually opaque market: who is selling what, where, at what price, and how that compares with the space around it. Ownership rules for lakeshore property, and the practical differences between the villages, are covered in the guides below.
Market pulse: how asking prices, inventory and price cuts are moving
Every capture of the corpus is kept, so the table below is the market’s own time series: how many listings we tracked, the median asking price and $/m², and, capture over capture, what share of listings cut their price, how deep the median cut was, and how much inventory arrived or left. The first captures cover fewer sources; the “Sources” column says how many sites stood behind each row.
Market pulse: every capture
Capture
Listings
Sources
Median asking
Median $/m²
$/m², same sources
Cut
Median cut
New
Gone
Sources compared
10 May 2026
4
1
$298,750
—
—
—
—
—
—
—
7 Aug 2026
12
2
$525,000
$1,271 (2)
$1,271 (2)
—
—
—
—
2 · n 0→1
3 Sep 2026
14
2
$525,000
$1,400 (3)
$1,400 (3)
—
—
—
—
2 · n 1→1
4 Sep 2026
145
19
$315,000
$1,405 (43)
$1,400 (3)
—
—
—
—
2 · n 1→1
15 Sep 2026
137
17
$337,500
$1,402 (44)
$1,271 (4)
0.7%
-10.9%
2.8%
1.4%
26 · n 140→142
5 Oct 2026
147
18
$320,000
$1,405 (41)
$1,400 (3)
2.2%
-23.1%
2.3%
8.1%
25 · n 136→128
15 Oct 2026
107
17
$450,000
$1,645 (15)
$1,400 (3)
0.9%
-26.2%
1.9%
0.9%
28 · n 107→108
Each row is one capture of the whole corpus after the viewer's inventory filters. "Sources" is how many sites stood behind the figure: when it rises, the listing count rises with coverage, not with the market; the medians and the percentages are the comparable series. Cut / new / gone are computed listing by listing against the previous capture, only for sources present in both, as a share of the previous capture (new: of the current one). "Sources compared" says how many sites entered that comparison and how many listings stood on each side (n before→after). Rule declared in advance: when either side holds fewer than 20 listings, the percentage prints as "—" rather than a number the sample cannot carry. The figure in brackets after a $/m² is how many listings stand behind that median. $/m² = asking price over construction m², houses and apartments with ≥20 m². "Same sources" uses only the sites present in EVERY capture (3): adding coverage cannot move it.
By zone, latest capture (15 Oct 2026)
Zone
Listings
Median asking
Median $/m²
Median $/m², previous capture
Santa Cruz La Laguna
22
$440,000
—
—
Panajachel
21
$490,000
$2,073 (4)
$1,400 (5 Oct)
Santiago Atitlán
19
$261,823
$538 (1)
$1,466 (5 Oct)
Other
9
$110,800
—
—
San Marcos La Laguna
8
$495,000
$2,317 (1)
$952 (5 Oct)
Sololá
8
$1,193,261
$1,317 (4)
$1,317 (5 Oct)
Santa Catarina Palopó
7
$525,000
$1,266 (3)
$1,405 (5 Oct)
Zones with at least 5 priced listings in the capture. The number in brackets is how many listings stand behind the $/m² figure.
Short-term rental asking rates (Airbnb)
What Airbnb hosts here are asking per night for a weekday stay about a month out, by size of place, captured once a month from live search results, each listing priced for the party size of the search that found it (2, 6 or 12 adults; the note under the table explains). This is the short-stay market; long-term rents live on the rent-price pages. Read the segments, not one headline number: large homes are over-represented in the sample.
Data collected 2026-10-17 for a 2026-11-17 to 2026-11-19 stay. Airbnb prices change daily and by date: check live before booking.
Type of stay
Median per night
Typical range (p25–p75)
Listings
Entire place, 2 guests
$101
$57–$163
21
Private room in a home, 2 guests
$52*
$30–$90
11
Hotel room listed on Airbnb, 2 guests
—
—
6
Entire place, 3–4 guests
$146
$119–$186
26
Entire place, 5–8 guests
$235
$180–$406
48
Entire place, 9+ guests
$418
$261–$545
62
Nightly rate as Airbnb showed it on those dates for the party size of the search that found each listing (2 adults for every place sleeping up to four; 6 or 12 adults only for larger homes that did not appear in the 2-adult search), with whatever Airbnb prices for that party already inside; where a promotion was displayed it is usually already inside the rate. The capture does not return cleaning or service fees, so there is no "all-in" figure. Sample: 183 listings (183 priced); 86% entire places, 5% hotel rooms, 61% superhosts; 14% displayed a promotion (median 13% off the crossed-out price); median rating 4.88 on a median 54 reviews. Typical place: 3 bedroom(s), 2 bath(s). Among listed amenities: Wi-Fi 96%, kitchen 88%, air conditioning 5%, pool 18%, free parking 54% (what the listing lists; absence is not proof it is missing). * = small sample (10–19 listings); — = fewer than 10 listings, no median.
Locality (as Airbnb labels it)
Median per night, all sizes
Listings
Panajachel
$245
28
San Marcos La Laguna
$163
23
San Pedro La Laguna
$145
22
Santa Catarina Palopó
$370*
18
San Lucas Toliman
$270*
14
Santa Cruz la Laguna
$162*
13
San Antonio Palopó
$280*
12
Santiago Atitlan
$236*
12
Localities with at least 12 priced listings and no single host above 40% of them; all sizes mixed, so a locality of large homes reads expensive. Villages and municipios appear exactly as Airbnb labels them.
Captured 2026-10-17 · 2026-11-17→2026-11-19 · USD (capture date · stay queried · currency), searched for 2, 6 and 12 adults, 2-night weekday stay. Captured once a month: a capped sample of Airbnb search results for one fixed 2-night weekday stay about a month ahead, priced for the party size of the search that found each listing (2 adults for anything sleeping up to four; 6 or 12 adults only for larger homes that did not appear in the 2-adult search). Not every listing, only those still open for those dates; the nightly rate Airbnb showed for that stay (a displayed promotion is usually already inside it), not booked rates. Large homes are over-represented in the sample, so compare the guest-count segments, not the overall median. Source: Airbnb search results via Apify.
Check today's prices on other platforms (each button opens that platform's own search for the place named; we do not compare their prices here)
Affiliate links: if you book, we earn a small commission at no extra cost to you. The buttons do not compare prices with the table above; they open each platform's own search. Airbnb has no affiliate program, which is why there is no Airbnb button.
Thinking of hosting instead of renting long-term? The Airbnb ROI page pairs these rates with the yield, tax and occupancy questions.
Filter the sample yourself
Pick guests, type, locality, rating and the amenities you need; the median and range recompute from the matching listings. Nothing here is a listing: only what a group of matching places is asking.
Data collected 2026-10-17 for a 2026-11-17 to 2026-11-19 stay (searches for 2, 6 and 12 adults). Airbnb prices change daily and by date: check live before booking.
–
matching listings
–
median per night (rate shown)
–
typical range p25–p75
–
of the market sample
Loading the sample…
Nightly rate as Airbnb showed it on those dates for the party size of the search that found each listing (2 adults for every place sleeping up to four; 6 or 12 adults only for larger homes that did not appear in the 2-adult search) (a displayed promotion is usually already inside it), before extra-guest fees, cleaning, service fees and taxes. A capped monthly sample of Airbnb search results (large homes are over-represented); amenities are what the listing lists. Under 10 matches: no median; 10–19: small sample. No individual listing is ever shown.
Guatemalan-American sharing what life is really like in Guatemala. Born here, lived in the US, came back -- and built this site to help others do the same.
We track 405 Antigua listings cut over cut: who dropped their price and how long things have sat. Subscribers get each new cut the moment it lands, with our read on what actually changed.
No spam. Unsubscribe anytime. We respect your privacy.
Open the ‘Agencies & sellers we track’ table above the grid — it names every agency and independent seller currently in the Lake Atitlán corpus, how many listings each one has, whether we captured it from the agency’s own website or from a portal it advertises on, and the date of the last capture. That table is generated from the data itself, so it can never disagree with the grid below it. The agency filter lets you browse any one seller’s full book, and every card links back to the seller who published it.
Which Lake Atitlán villages does this cover?
The village filter is built from the listings themselves rather than from a list we typed, so it grows and shrinks with the market. At the 5 October 2026 capture it covered Panajachel, Santa Cruz La Laguna, Santa Catarina Palopó, Santiago Atitlán, San Lucas Tolimán, San Marcos La Laguna, San Antonio Palopó, San Pedro La Laguna, San Andrés Semetabaj, Santa Clara La Laguna, San Pablo La Laguna and Sololá, plus an ‘Other’ entry for listings we cannot place in a named village. The filter itself is the current answer — it is generated from the same data as the cards.
Why do some Lake Atitlán cards carry no price-cut badge?
Price-cut, new and days-listed badges come from comparing two snapshots of the same source, so a source added in the current cycle carries no badge until we capture it a second time. The badges appear on their own once the second capture lands; nothing else about the listing changes.
Are the prices in dollars or quetzales?
Both, as published. Sellers who advertise in US dollars are shown in dollars. Quetzal asking prices are converted at the Banguat reference rate printed under the grid — the rate and the date it applies to come from the same data file as the listings — and the card keeps the original quetzal amount beside the converted figure so you can check the conversion.
Are these listings current, and can you tell me what a property sold for?
These are the sellers’ public asking prices, refreshed every two weeks, and every card links to the seller so you can confirm the current status before you act on it. We cannot tell you sale prices: sales are inscribed at the Registro General de la Propiedad finca by finca, not in a list we can match these listings against, so a listing that disappears is marked ’no longer listed’ and never ‘sold’ — it may equally have been withdrawn.