Every Flores and Petén sale listing we track, one grid.
All listings 40
Filter by zone, agency, type, bedrooms and price; sort by biggest cut or $/m². Every card links to the seller.
Agencies & sellers we track9 + 3 · 40 listings · 24 on 2+ sources · 16 with 2+ sellers
| Agency / seller | Listings | Source | Last refresh |
|---|---|---|---|
| Imperio Guatemala | 16 | agency website | 1 Oct 2026 |
| Delta Real Estate | 7 | agency website | 1 Oct 2026 |
| Inmobiliaria Santander | 4 | agency website | 1 Oct 2026 |
| RE/MAX GOLD | 3 | via portal | 1 Oct 2026 |
| Consulta Inmobiliaria | 2 | agency website | 1 Oct 2026 |
| M2Guate | 1 | agency website | 1 Oct 2026 |
| Grupo Tala | 1 | agency website | 1 Oct 2026 |
| Remax Colonial | 1 | agency website | 1 Oct 2026 |
| NL Punto | 1 | agency website | 1 Oct 2026 |
A further 3 sellers with 1–2 listings each (4 in total) appear in the agency filter.


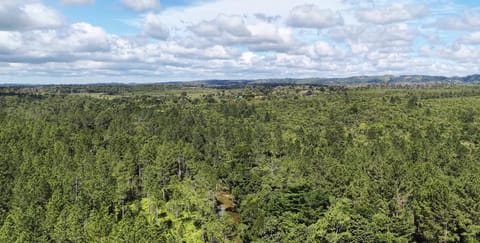
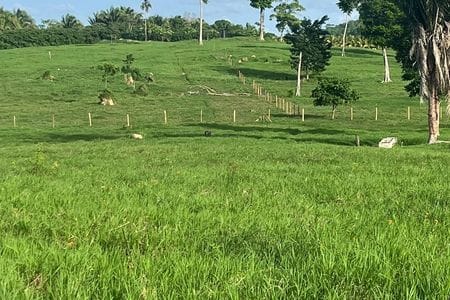
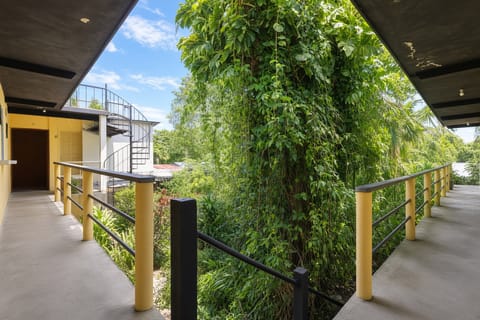
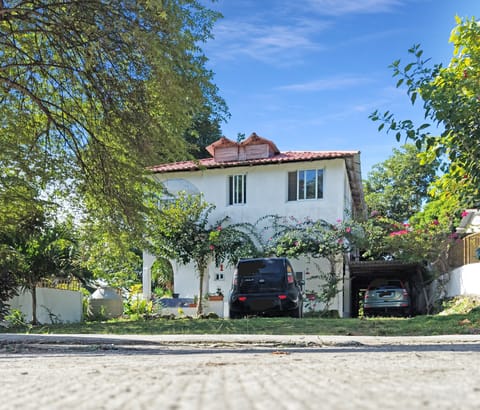
Tracking window: 16 days since the previous capture; the new / price-cut badges refer to that span.
Asking prices, captured from the agencies' own public sites and from the portals they advertise on. Quetzal prices are converted to USD at the Banguat reference rate of Q7.63856/US$ dated 2026-09-30, and the card also shows the original quetzal amount. "% vs zone median" compares construction $/m² against that zone's median (zones with ≥5 priced listings). Every card links to the seller who published it. When several sellers offer the same property, the card names each one with the price that seller asked on the capture date; a difference usually reflects a stale copy, furnishings or taxes included, not a negotiable spread.
Save this search: email alerts for new listings and price cuts are on the way
We re-capture every seller we track roughly every two weeks. Email alerts for this search are being built: set the filters above, leave your email, and you will be first in when they go live, with what changed in this search at every capture.
Your search: everything in Flores and Petén
How this works
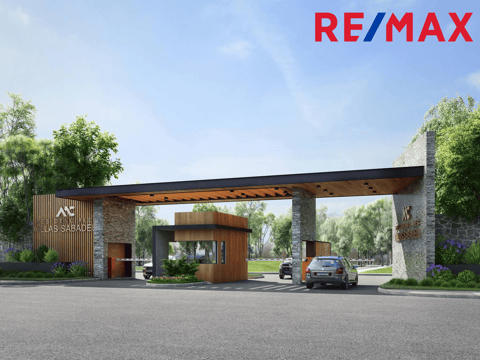
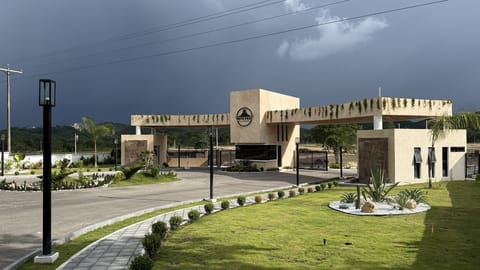
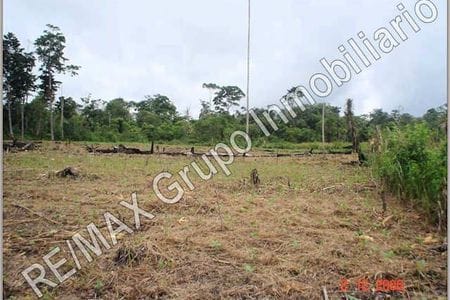
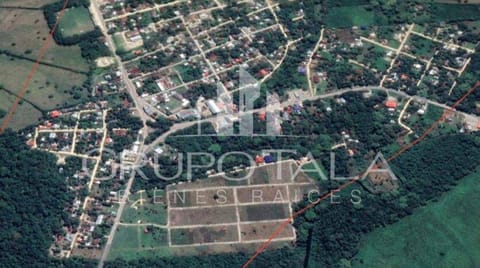
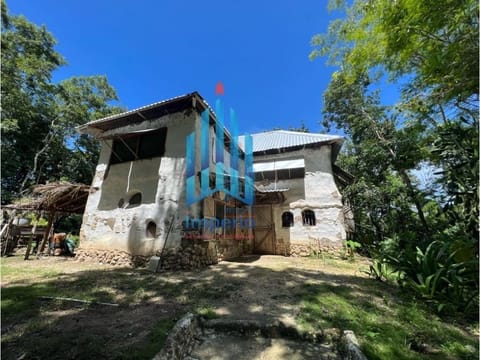
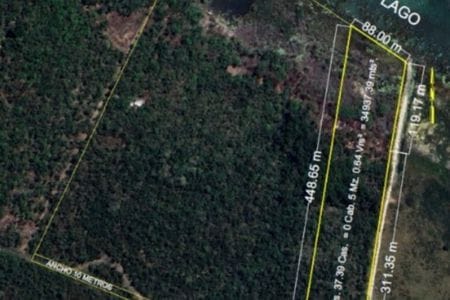
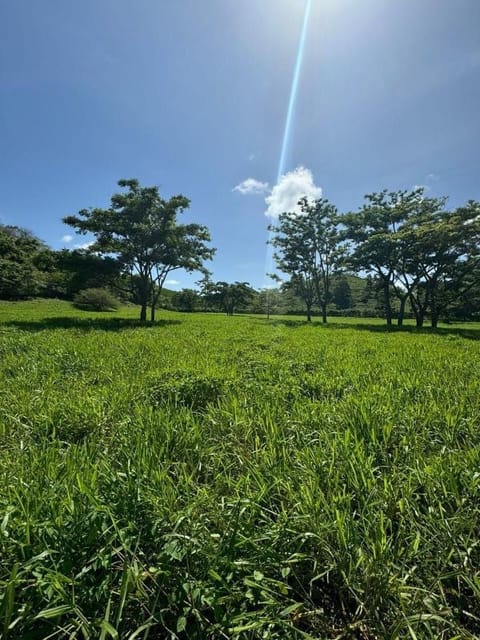
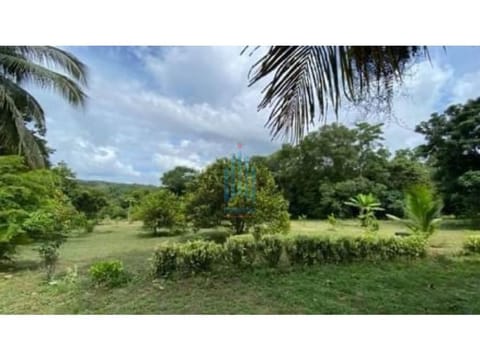
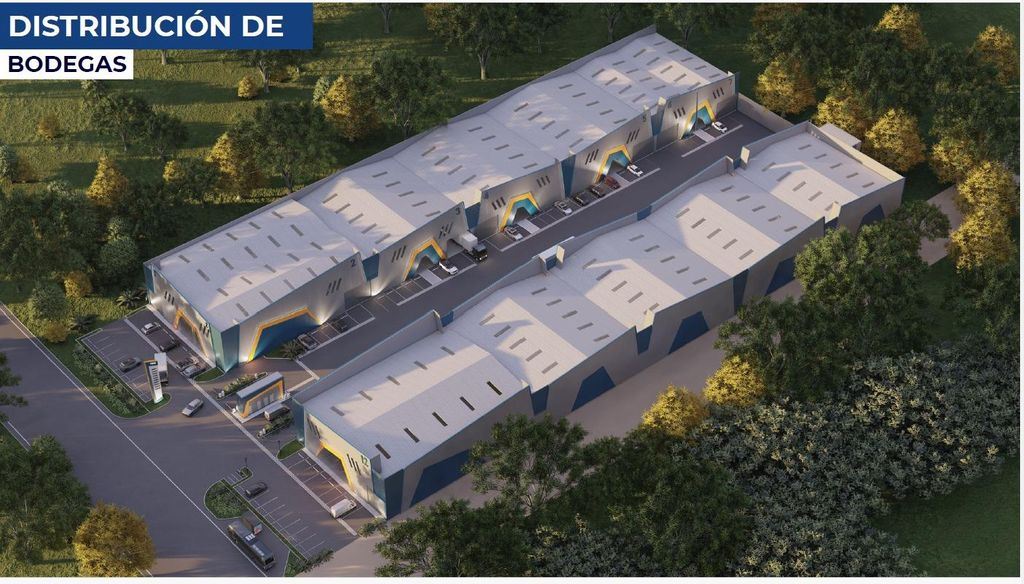
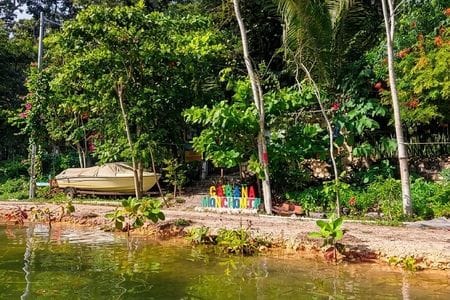
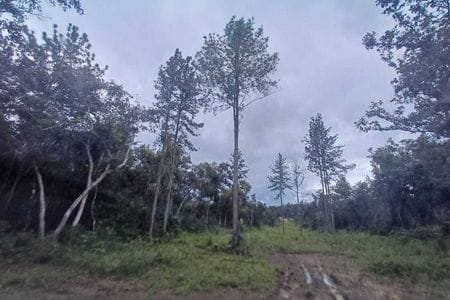
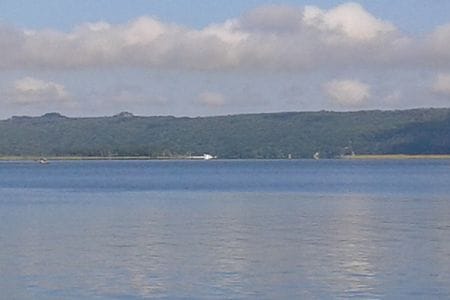
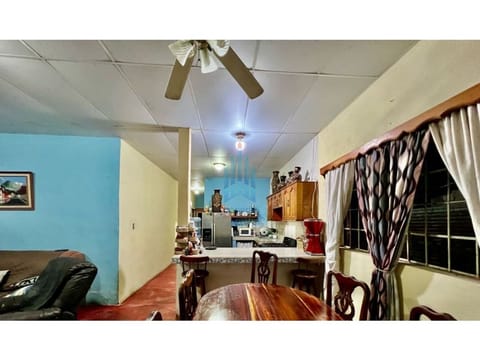
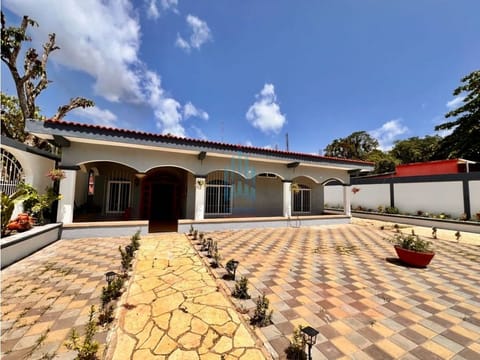
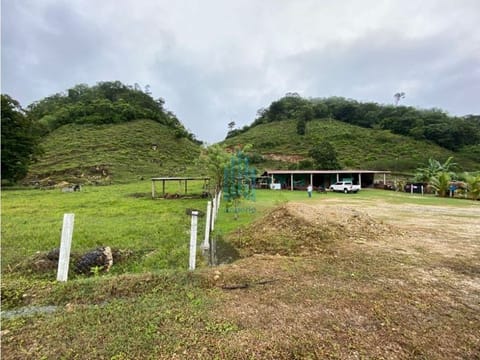
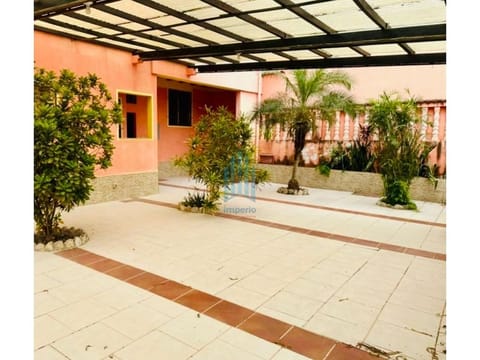
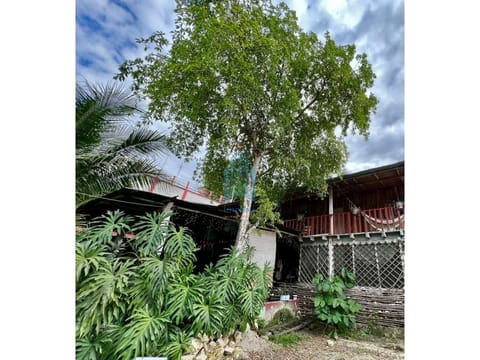
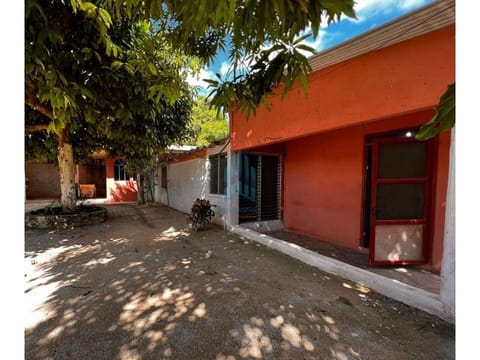
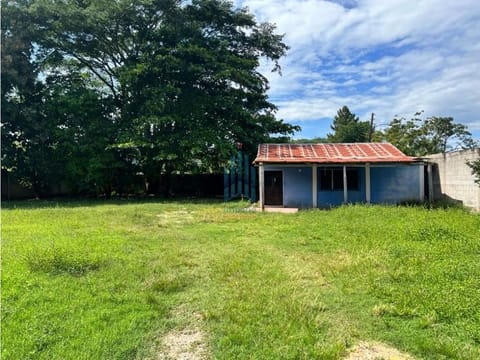
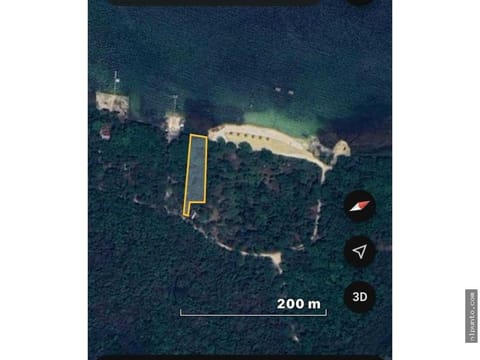
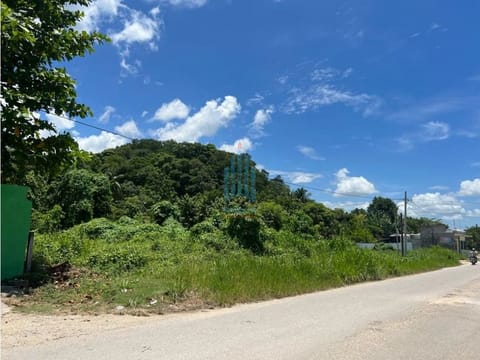
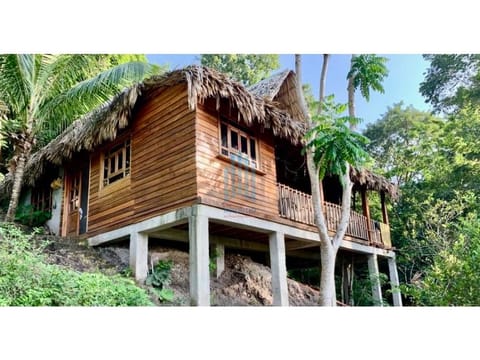
This page is the Petén market of the sale-listings aggregator. We capture the public sale inventories of the agencies that sell in the department from their own websites, add the listings that agencies and independent sellers publish on the portals, merge the same property advertised in two places into one card (the card says where else it appears), and refresh every two weeks. Each card carries the name of the seller who published it, one thumbnail loaded from the seller’s site, a short excerpt and a link to the original advert; we do not copy galleries or full descriptions, and private sellers appear as “Particular (private seller)” without names or phone numbers. A seller who wants a listing removed can write to stu@livinginguatemala.com and it comes down at the next deploy. The rules are the same on every viewer on this site and are described once on the methodology page.
The badges come from comparing captures of the same source over time: price cut (the asking price dropped, old price struck through), new (appeared since the last capture) and days listed (present across the tracking window). A source earns badges only once we have captured it twice, so a seller added in the current cycle carries none until its second capture.
Municipios in the Petén grid
Which municipios of Petén hold listings, how many each one holds, and what they ask, computed from the feed when the page is built:
| Zona / municipio | Listings | Median asking, houses & apartments | Median $/m² |
|---|---|---|---|
| Dolores | 1 | — | — |
| Flores | 12 | $261,829 (1) | — |
| La Libertad | 3 | $183,281 (1) | — |
| Poptún | 3 | — | — |
| San Andrés | 1 | — | — |
| San Benito | 9 | $124,369 (3) | — |
| San Francisco | 1 | — | — |
| San José | 4 | $85,095 (1) | — |
| Sayaxché | 3 | — | — |
| Other | 3 | $180,000 (1) | — |
Every row is computed from the feed when the page is built. "Listings" is the zona's whole inventory in the current capture, every type. The median asking price covers priced houses and apartments only; the number in brackets is how many listings stand behind that median. Median $/m² is asking price over construction m² and the feed only publishes it for zonas with at least 5 priced listings, so "—" means the feed does not compute one. The zona is the one the seller declared: metropolitan municipios appear under their own name rather than a zona number. Linked zonas open their full inventory, with no cap.
The municipio filter on the grid is built from the same rows, so it grows and shrinks with the market. A municipio gets its own uncapped viewer page only once it carries at least 100 listings and holds less than three quarters of the market on its own; until then, this page is its grid.
What the numbers on the cards mean
The grid above holds 40 Petén sale listings right now; that figure renders from the same file as the cards, so it cannot drift away from them. Every property type the sellers publish sits in one corpus, and the type filter splits them. Every card is an asking price published by a named seller, never a sale price.
Currency. Sellers who advertise in US dollars are shown in dollars. Quetzal asking prices are converted at the Banguat reference rate printed under the grid, and those cards keep the original quetzal amount next to the converted figure.
$/m² and the municipio median. Where a listing publishes a construction area we compute its asking price per m². The “% vs zone median” comparison needs at least five priced listings with a known construction area in the same municipio, so it appears only where the data supports it; elsewhere a card shows the $/m² figure alone, and a listing with no published construction area shows neither.
Market pulse: Petén asking prices over time
We keep every capture of the corpus, so this table is the market’s own series: how many listings we tracked, the median asking price and $/m², and, capture over capture, what share of listings cut their price and how much inventory arrived or left. The series starts when we began capturing this department’s agencies, so the early rows stand on fewer sources; the “Sources” column says how many sites stood behind each row, and a delta drawn from a small sample prints as a dash rather than a percentage.
Market pulse: every capture
| Capture | Listings | Sources | Median asking | Median $/m² | $/m², same sources | Cut | Median cut | New | Gone | Sources compared |
|---|---|---|---|---|---|---|---|---|---|---|
| 10 May 2026 | 1 | 1 | $362,958 | — | — | — | — | — | — | — |
| 7 Aug 2026 | 1 | 1 | $362,958 | — | — | — | — | — | — | 2 · n 1→1 |
| 3 Sep 2026 | 1 | 1 | $362,958 | — | — | — | — | — | — | 2 · n 1→1 |
| 1 Oct 2026 | 43 | 10 | $314,235 | $760 (7) | — | — | — | — | — | 23 · n 6→21 |
Each row is one capture of the whole corpus after the viewer's inventory filters. "Sources" is how many sites stood behind the figure: when it rises, the listing count rises with coverage, not with the market; the medians and the percentages are the comparable series. Cut / new / gone are computed listing by listing against the previous capture, only for sources present in both, as a share of the previous capture (new: of the current one). "Sources compared" says how many sites entered that comparison and how many listings stood on each side (n before→after). Rule declared in advance: when either side holds fewer than 20 listings, the percentage prints as "—" rather than a number the sample cannot carry. The figure in brackets after a $/m² is how many listings stand behind that median. $/m² = asking price over construction m², houses and apartments with ≥20 m². "Same sources" uses only the sites present in EVERY capture (3): adding coverage cannot move it.
By zone, latest capture (1 Oct 2026)
| Zone | Listings | Median asking | Median $/m² | Median $/m², previous capture |
|---|---|---|---|---|
| Flores | 13 | $230,915 | $680 (2) | — |
| San Benito | 9 | $124,369 | $518 (1) | — |
Zones with at least 5 priced listings in the capture. The number in brackets is how many listings stand behind the $/m² figure.
What this viewer does not do
It does not rank municipios, quote a market average outside the tables above, or tell you what anything sold for. Everything here is a public asking price on a known date, from a named seller, with the arithmetic done in the open. Ownership rules, closing costs and the property tax are covered in the guides below; read them before you make an offer.
Before you buy
- Buying property in Guatemala: the complete guide
- Rules for foreign buyers
- Closing costs in Guatemala
- Property taxes (IUSI)
Related
- Flores and Petén real estate: renting and buying near Tikal: rents and where to look
- Flores: the municipality page
- San Benito: the municipality page
- Other regional markets: Quetzaltenango (Xela) listings · Cobán and Alta Verapaz listings
- Antigua Guatemala listings · Guatemala City listings · Lake Atitlán listings · Pacific coast listings · Guatemala Real Estate hub