This is not radar. It is NASA’s IMERG rain estimate: a picture of where satellites estimate rain fell over Guatemala in each half hour, drawn in colour on top of the GOES-East infrared cloud image from the start of the same half hour. For ten places, the table below reads the estimate for each of the 48 half-hours before NASA’s newest frame, so you can see whether it rained at Antigua, Lake Atitlán or Semuc Champey in that day and how hard.
The newest satellite rain frame
Pulled Sep 25, 2026 at 14:41 Guatemala time from NASA GIBS (IMERG and GOES-East).
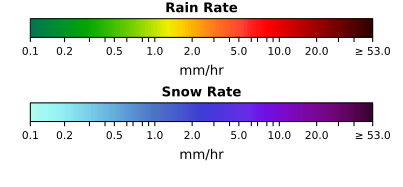
IMERG rain estimate for the half hour starting Sep 25 at 08:30 Guatemala time, the newest frame NASA had published when we checked, 6 h 11 min after that half hour began; underneath, the infrared image from the start of the same half hour. Where there is no colour the estimate is below 0.1 mm/hr or there is no data: NASA draws both as transparent.
1 Guatemala City (La Aurora) · 2 Antigua Guatemala · 3 Panajachel, Lake Atitlán · 4 Acatenango summit · 5 Cobán · 6 Semuc Champey · 7 Tikal · 8 Río Dulce (Fronteras) · 9 Livingston · 10 Monterrico
The 24 hours before NASA’s newest frame, at ten places
About 6 hours behind real time: the caption under the map gives the newest frame’s time and lag.
Pulled Sep 25, 2026 at 14:41 Guatemala time from NASA GIBS (IMERG and GOES-East).
| # | Place | Newest half hour | Highest estimate in 24 h | Half-hours with estimated rain |
|---|---|---|---|---|
| 1 | Guatemala City (La Aurora) | below 0.1 mm/hr or no data | 3.0–3.2 mm/hr Sep 24, 14:00 | 18 of 48 |
| 2 | Antigua Guatemala | below 0.1 mm/hr or no data | 1.78–1.88 mm/hr Sep 24, 13:30 | 21 of 48 |
| 3 | Panajachel, Lake Atitlán | below 0.1 mm/hr or no data | 4.0–4.2 mm/hr Sep 24, 22:00 | 23 of 48 |
| 4 | Acatenango summit | below 0.1 mm/hr or no data | 2.7–2.8 mm/hr Sep 24, 13:00 | 20 of 48 |
| 5 | Cobán | below 0.1 mm/hr or no data | 4.2–4.5 mm/hr Sep 24, 14:00 | 25 of 48 |
| 6 | Semuc Champey | below 0.1 mm/hr or no data | 7.1–7.5 mm/hr Sep 24, 21:00 | 32 of 48 |
| 7 | Tikal | below 0.1 mm/hr or no data | 3.2–3.3 mm/hr Sep 24, 19:00 | 18 of 48 |
| 8 | Río Dulce (Fronteras) | below 0.1 mm/hr or no data | 2.7–2.8 mm/hr Sep 24, 23:30 | 24 of 48 |
| 9 | Livingston | below 0.1 mm/hr or no data | 1.68–1.78 mm/hr Sep 24, 11:30 | 26 of 48 |
| 10 | Monterrico | below 0.1 mm/hr or no data | 3.0–3.2 mm/hr Sep 24, 18:00 | 18 of 48 |
Values in mm/hr: the interval of NASA's colour in the IMERG cell (0.1 degree, about 11 km) that contains each point; times are Guatemala time and mark the start of each half hour. The 24 hours end at the newest published half hour, not at the moment you read this.
Half-hour by half-hour for the same 24 hours:
Pulled Sep 25, 2026 at 14:41 Guatemala time from NASA GIBS (IMERG and GOES-East).
| Place | The 24 h before NASA's newest frame, oldest to newest (blue = estimated rain of 0.1 mm/hr or more) |
|---|---|
| Guatemala City (La Aurora) | |
| Antigua Guatemala | |
| Panajachel, Lake Atitlán | |
| Acatenango summit | |
| Cobán | |
| Semuc Champey | |
| Tikal | |
| Río Dulce (Fronteras) | |
| Livingston | |
| Monterrico |
The newest cloud image
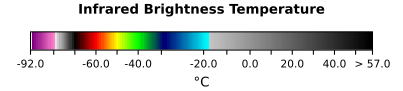
The infrared image is newer than the rain estimate, but it shows only clouds, not rain. It is the GOES-East Band 13 “Clean Infrared” channel, which NASA’s layer note describes as useful for detecting clouds all times of day and night.
Pulled Sep 25, 2026 at 14:41 Guatemala time from NASA GIBS (IMERG and GOES-East).
GOES-East Band 13 infrared image of Sep 25 at 13:30 Guatemala time, the newest at our check. Clouds only: no rain layer.
1 Guatemala City (La Aurora) · 2 Antigua Guatemala · 3 Panajachel, Lake Atitlán · 4 Acatenango summit · 5 Cobán · 6 Semuc Champey · 7 Tikal · 8 Río Dulce (Fronteras) · 9 Livingston · 10 Monterrico
What this map is, and what it is not
- A satellite estimate, not a measurement. NASA describes IMERG as combining passive-microwave observations from the GPM satellite constellation, infrared observations from geosynchronous satellites and calibration data from rain gauges, on a 0.1 x 0.1 degree grid (about 11 by 11 km at the Equator). A value here covers the whole cell around a place, not one street.
- Hours behind, not live. NASA’s note says the latest imagery is available approximately 5 hours prior to the current time. On our first check (25 September 2026) the newest rain frame was 5 hours 52 minutes old. This page is rebuilt once a day; the newest frame’s time is printed above; hover a strip cell for its half hour.
- An empty cell does not mean it did not rain. NASA’s colour map draws an estimate below 0.1 mm per hour and a cell with no data the same way: transparent.
- Early, then final. The frames here are NASA’s early estimate; NASA replaces it with a final estimate about four months later, once calibration data such as monthly rain-gauge analyses are in.
Why there is no radar on this page
Of the two sources we checked, neither is licensed for an ad-supported site without a separate agreement. RainViewer, which serves radar mosaics, states that its API is available for personal and educational use only, and this site carries advertising. INSIVUMEH (Instituto Nacional de Sismología, Vulcanología, Meteorología e Hidrología) returned eight results for radar in its own site search on 25 September 2026: news posts and pages, none of them a radar image or radar data page. If a licensed radar feed appears, it will be added here.
For newer frames than this page’s daily check, open the same layers in NASA Worldview.
Related pages
- What the airport actually observed: Guatemala City weather (La Aurora reports, last 24 h).
- Forecasts for the main destinations: Antigua, Lake Atitlán, Semuc Champey and the weather hub.
- Tropical storms and hurricanes near Guatemala: the hurricane tracker.
Sources
We acknowledge the use of imagery provided by services from NASA's Global Imagery Browse Services (GIBS), part of NASA's Earth Science Data and Information System (ESDIS). Rain: IMERG (GPM, NASA), layer IMERG_Precipitation_Rate_30min. Clouds: GOES-East ABI Band 13, via GIBS. Borders and roads: GIBS layer Reference_Features_15m, with data from © OpenStreetMap contributors (available under the Open Database License) and Natural Earth. NASA does not endorse this site.
- NASA GIBS, API documentation (acknowledgement) and Earthdata data-use guidance: data from NASA-led missions (IMERG) are licensed CC0 unless marked otherwise, and ESDIS content, including images, is generally not copyrighted and may be used in a factual manner that does not imply NASA’s endorsement, with NASA acknowledged (the cloud images come through GIBS, part of ESDIS).
- Layer notes: IMERG Precipitation Rate (30-min) and GOES-East ABI Band 13, NASA Worldview layer descriptions, read 25 September 2026.
Frequently Asked Questions
Is there a live weather radar for Guatemala?
Of the two sources we checked, neither is licensed for an ad-supported site without a separate agreement. RainViewer, which publishes radar mosaics, says its API is for personal and educational use only, and a search of INSIVUMEH’s website for radar on 25 September 2026 returned news posts and pages but no radar image or radar data page. This page shows a different product instead: NASA’s IMERG rain estimate, made from satellites.
How current is the rain map?
NASA’s note on the layer says the latest rain imagery is available approximately 5 hours prior to the current time. On our first check (25 September 2026) the newest rain frame was 5 hours 52 minutes old, and the cloud image 52 minutes old; the caption under the map gives the lag at the latest check. This page is rebuilt once a day, so for newer frames open NASA Worldview from the link on this page.
Does a place with no colour on the map mean it is not raining?
No. NASA draws both an estimate below 0.1 mm per hour and a cell with no data as transparent, so an empty spot only means the estimate did not reach 0.1 mm per hour or was missing for that half hour.
How accurate is the IMERG rain estimate?
It is an estimate, not a gauge reading at your street. NASA builds it from microwave satellite observations, geostationary infrared and rain-gauge calibration on a grid of 0.1 degrees, about 11 by 11 km at the Equator, and replaces the early estimate shown here with a final one about four months later. Each value on this page describes the whole cell around a place.